CytoSpec - an APPLICATION FOR HYPERSPECTRAL IMAGING |
||||||||||||||||||||||||||||||||||||||||||||||||||||||||||||||||||||||||||||||||||||||||||||||||||||||||||||||||||||||||||||||||||||||||||||||||||||||||||||||||||||||||||||||||||||||||||||||||||||||||||||||||||||||||||||||||||||||||||||||


|
||||||||||||||||||||||||||||||||||||||||||||||||||||||||||||||||||||||||||||||||||||||||||||||||||||||||||||||||||||||||||||||||||||||||||||||||||||||||||||||||||||||||||||||||||||||||||||||||||||||||||||||||||||||||||||||||||||||||||||||
|
|
|
|||||||||||||||||||||||||||||||||||||||||||||||||||||||||||||||||||||||||||||||||||||||||||||||||||||||||||||||||||||||||||||||||||||||||||||||||||||||||||||||||||||||||||||||||||||||||||||||||||||||||||||||||||||||||||||||||||||||||||||
|
|
||||||||||||||||||||||||||||||||||||||||||||||||||||||||||||||||||||||||||||||||||||||||||||||||||||||||||||||||||||||||||||||||||||||||||||||||||||||||||||||||||||||||||||||||||||||||||||||||||||||||||||||||||||||||||||||||||||||||||||||
Menu Bar 'File' |
||||||||||||||||||||||||||||||||||||||||||||||||||||||||||||||||||||||||||||||||||||||||||||||||||||||||||||||||||||||||||||||||||||||||||||||||||||||||||||||||||||||||||||||||||||||||||||||||||||||||||||||||||||||||||||||||||||||||||||||
|
||||||||||||||||||||||||||||||||||||||||||||||||||||||||||||||||||||||||||||||||||||||||||||||||||||||||||||||||||||||||||||||||||||||||||||||||||||||||||||||||||||||||||||||||||||||||||||||||||||||||||||||||||||||||||||||||||||||||||||||
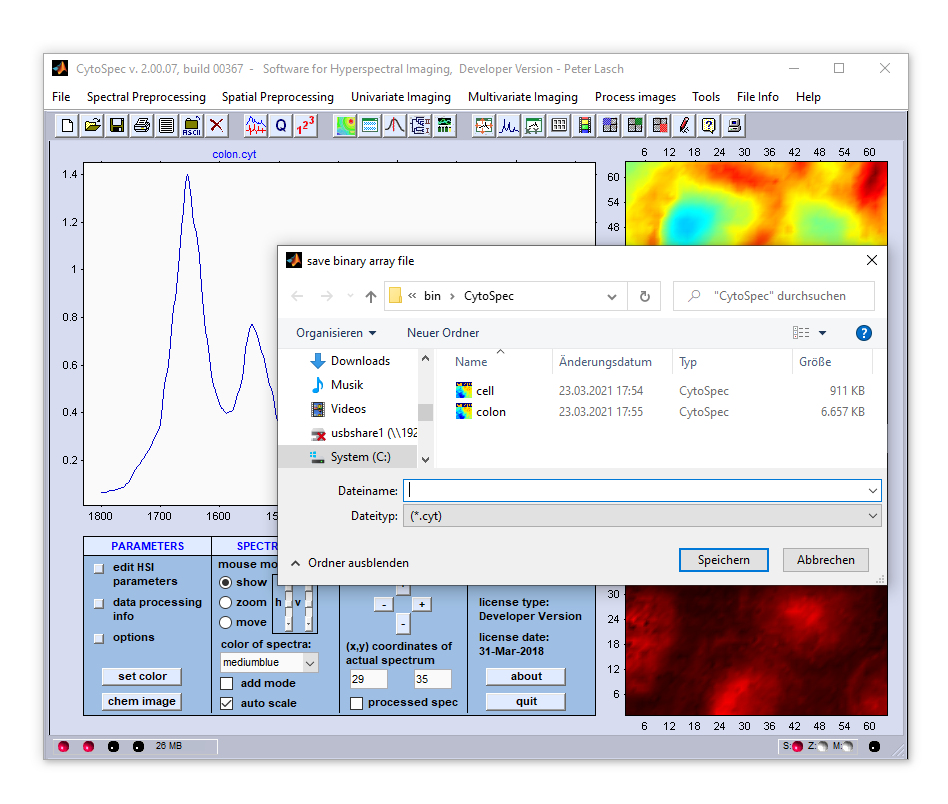
Load and Save Data |
||||||||||||||||||||||||||||||||||||||||||||||||||||||||||||||||||||||||||||||||||||||||||||||||||||||||||||||||||||||||||||||||||||||||||||||||||||||||||||||||||||||||||||||||||||||||||||||||||||||||||||||||||||||||||||||||||||||||||||||
|
||||||||||||||||||||||||||||||||||||||||||||||||||||||||||||||||||||||||||||||||||||||||||||||||||||||||||||||||||||||||||||||||||||||||||||||||||||||||||||||||||||||||||||||||||||||||||||||||||||||||||||||||||||||||||||||||||||||||||||||
Save Matlab |
||||||||||||||||||||||||||||||||||||||||||||||||||||||||||||||||||||||||||||||||||||||||||||||||||||||||||||||||||||||||||||||||||||||||||||||||||||||||||||||||||||||||||||||||||||||||||||||||||||||||||||||||||||||||||||||||||||||||||||||
|
||||||||||||||||||||||||||||||||||||||||||||||||||||||||||||||||||||||||||||||||||||||||||||||||||||||||||||||||||||||||||||||||||||||||||||||||||||||||||||||||||||||||||||||||||||||||||||||||||||||||||||||||||||||||||||||||||||||||||||||
Load ASCII Data |
||||||||||||||||||||||||||||||||||||||||||||||||||||||||||||||||||||||||||||||||||||||||||||||||||||||||||||||||||||||||||||||||||||||||||||||||||||||||||||||||||||||||||||||||||||||||||||||||||||||||||||||||||||||||||||||||||||||||||||||
|
||||||||||||||||||||||||||||||||||||||||||||||||||||||||||||||||||||||||||||||||||||||||||||||||||||||||||||||||||||||||||||||||||||||||||||||||||||||||||||||||||||||||||||||||||||||||||||||||||||||||||||||||||||||||||||||||||||||||||||||
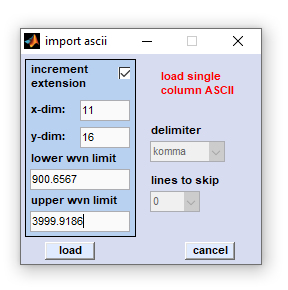
Import Single Column ASCII Data |
||||||||||||||||||||||||||||||||||||||||||||||||||||||||||||||||||||||||||||||||||||||||||||||||||||||||||||||||||||||||||||||||||||||||||||||||||||||||||||||||||||||||||||||||||||||||||||||||||||||||||||||||||||||||||||||||||||||||||||||
|
||||||||||||||||||||||||||||||||||||||||||||||||||||||||||||||||||||||||||||||||||||||||||||||||||||||||||||||||||||||||||||||||||||||||||||||||||||||||||||||||||||||||||||||||||||||||||||||||||||||||||||||||||||||||||||||||||||||||||||||

 Load
Load 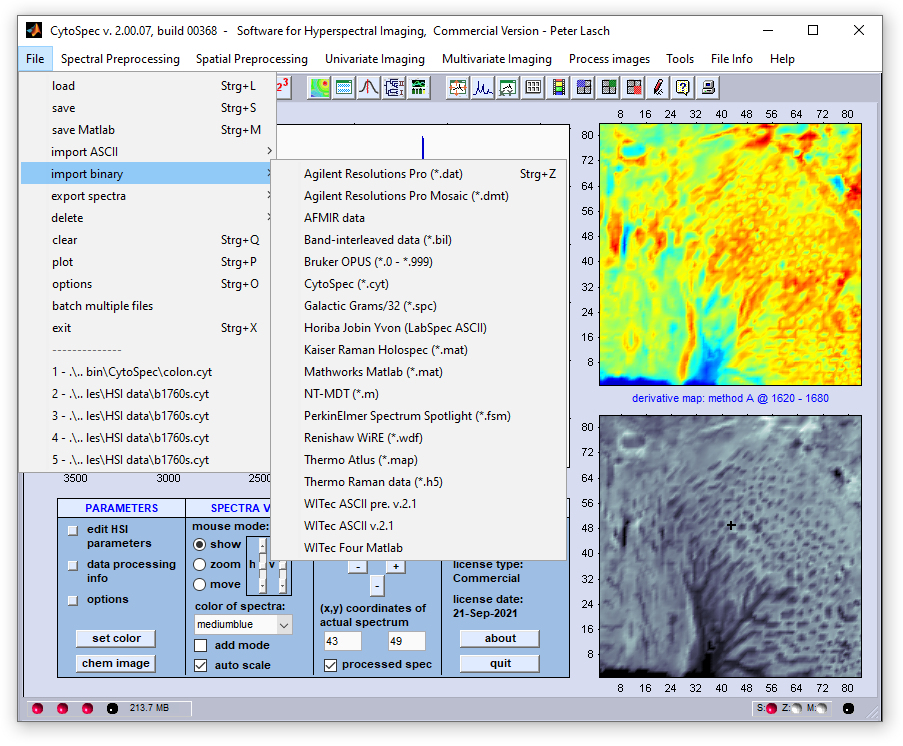
|
|
Edit fields xdim and ydim: [x,y] spatial dimensions of the hyperspectral image to be imported (in pixels). The CytoSpec testdata directory (see directory ...\CytoSpec\CytoSpec\Testdata\ASCII\y) contains an example of single column ASCII data with xdim × xydim = 11 × 16 (→ 176 spectra). In order to import the complete hyperspectral image, all ASCII files must reside in one directory. Please make sure that all ASCII files are of equal length, i.e. contain the same number of lines .
Edit fields with the wavenumber range (upper / lower wvn limit): Please indicate the highest (upper limit) and the lowest (lower limit) values. Note that CytoSpec assumes a equidistant point spacing in the spectral dimension.
Increment extension: The checkbox marked 'increment extension' determines if the spectra [x,y] positions are taken from extensions or file names. One can either import single column ASCII data incremented by file extension (e.g. spec.0, spec.1 ... spec.999) or files in which a numeric part of the filename is incremented (for example spec0001.0, spec0002.0, spec0003.0, ..... , spec9999.0). Check the 'increment extension' checkbox to load ASCII files incremented by their extension. Otherwise it is assumned that the spatial position is encoded by filenames (allows loading of 10.000 single spectra max, otherwise of 1000 spectra).
After pressing the 'load' button, a standard file window will appear, in which you may browse the directory structure of your computer or network connections. Select then the first ASCII data file and press the 'load' button. A progress indicator will show the progress of loading files. In case of problems please try first to import ASCII data of the ...\CytoSpec\CytoSpec\Testdata\ASCII\y directory. Contact only then the CytoSpec support.
Delimiter: this popupmenu is inactive
Lines to skip: this popupmenu is inactive

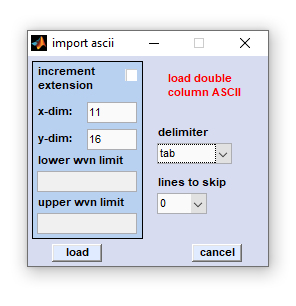
Import Double Column ASCII Data
This function can be used to import double column ASCII data from hyperspectral imaging measurements of rectangular sample areas with an
equal point spacing in x- and y-direction. The routine assumes furthermore that all spectra vectors are of the same length. Missing spectra
and/or missing frequency / absorbance / intensity values will cause abnormal termination of the ASCII import routine.
Data format: Double column ASCII data represent two column vectors of wavenumber / frequency data and absorbance/transmittance/Raman
intensity data, respectively (see example below) from high to low wavenumbers, or frequencies. Allowed delimiters between the first and the
second column data are comma [,], space [ ], tab [ ] and semicolon [;]. During data file loading, the program will automatically determine
the spatial position of the spectra, either from the ASCII file names, or from the numeric file extension (see below for details).
Example of a double column ASCII file
|
|
Edit fields xdim and ydim: [x,y] spatial dimensions of the hyperspectral image to be imported (in pixels). The CytoSpec testdata directory (see directory ...\CytoSpec\CytoSpec\Testdata\ASCII\xy) contains an example of double column ASCII data with xdim × xydim = 11 × 16 (→ 176 spectra). In order to import the complete hyperspectral image, all ASCII files must reside in one directory. Please make sure that all ASCII files are of equal length, i.e. contain the same number of lines .
Edit fields with the wavenumber range these fields are inactive
Delimiter: the following delimiters are allowed: comma, space, tab, and semicolon.
Lines to skip: ASCII data files may contain header lines with some text information which cannot be analyzed by CytoSpec program. To avoid errors during loading please indicate the number of lines, which should be skipped by the double column ASCII import routine.
Increment extension: The checkbox marked 'increment extension' determines if the spectra [x,y] positions are taken from extensions or file names. One can either import single column ASCII data incremented by file extension (e.g. spec.0, spec.1 ... spec.999) or files in which a numeric part of the filename is incremented (for example spec0001.0, spec0002.0, spec0003.0, ..... , spec9999.0). Check the 'increment extension' checkbox to load ASCII files incremented by their extension. Otherwise it is assumed that the spatial position is encoded by filenames (allows loading of 10.000 single spectra max, otherwise of 1000 spectra).
After pressing the 'load' button, a standard file window will appear, in which you may browse the directory structure of your computer or network connections. Select then the first ASCII data file and press the 'load' button. A progress indicator will show the progress of loading files. In case of problems please try first to import ASCII data of the ...\CytoSpec\CytoSpec\Testdata\ASCII\xy directory. Contact only then the CytoSpec support.
Import yxz-1 ASCII Data
This option permits loading ASCII data from hyperspectral imaging experiments.
The example below illustrates the expected format of a xyz-1 ASCII file (4 x 4 spectra).
First column: spatial coordinate x
Second column: spatial coordinate y
First line: wavenumber / frequency position
Second line: intensity / absorbance / transmittance values of the spectrum at position [x(1),y(1)].
The separator is tab
| 1641.69 | 1640.83 | 1639.98 | 1639.12 | 1638.27 | 1637.41 | 1636.56 | 1635.7 | 1634.84 | . . . | 702.739 | 701.726 | ||
| 1 | 4 | 0.1245 | 0.1242 | 0.1250 | 0.1263 | 0.1249 | 0.1262 | 0.1241 | 0.1254 | 0.1251 | . . . | 0.1244 | 0.1244 |
| 1 | 7 | 0.1233 | 0.1243 | 0.1247 | 0.1251 | 0.1275 | 0.1254 | 0.1249 | 0.1249 | 0.1237 | . . . | 0.1245 | 0.1256 |
| 1 | 10 | 0.1259 | 0.1220 | 0.1242 | 0.1239 | 0.1252 | 0.1225 | 0.1223 | 0.1242 | 0.1245 | . . . | 0.1279 | 0.1240 |
| 1 | 13 | 0.1243 | 0.1258 | 0.1254 | 0.1225 | 0.1256 | 0.1259 | 0.1261 | 0.1231 | 0.1252 | . . . | 0.1255 | 0.1258 |
| 3 | 4 | 0.1237 | 0.1218 | 0.1254 | 0.1235 | 0.1244 | 0.1256 | 0.1242 | 0.1247 | 0.1249 | . . . | 0.1240 | 0.1239 |
| 3 | 7 | 0.1243 | 0.1220 | 0.1254 | 0.1252 | 0.1247 | 0.1246 | 0.1249 | 0.1237 | 0.1234 | . . . | 0.1240 | 0.1264 |
| 3 | 10 | 0.1248 | 0.1255 | 0.1247 | 0.1211 | 0.1242 | 0.1247 | 0.1246 | 0.1241 | 0.1245 | . . . | 0.1232 | 0.1263 |
| 3 | 13 | 0.1225 | 0.1235 | 0.1239 | 0.1241 | 0.1237 | 0.1242 | 0.1250 | 0.1241 | 0.1241 | . . . | 0.1237 | 0.1248 |
| 5 | 4 | 0.1256 | 0.1239 | 0.1252 | 0.1249 | 0.1251 | 0.1254 | 0.1252 | 0.1252 | 0.1241 | . . . | 0.1232 | 0.1244 |
| 5 | 7 | 0.1236 | 0.1233 | 0.1250 | 0.1231 | 0.1240 | 0.1226 | 0.1234 | 0.1243 | 0.1235 | . . . | 0.1240 | 0.1252 |
| 5 | 10 | 0.1226 | 0.1246 | 0.1244 | 0.1258 | 0.1225 | 0.1233 | 0.1248 | 0.1237 | 0.1243 | . . . | 0.1255 | 0.1232 |
| 5 | 13 | 0.1251 | 0.1236 | 0.1247 | 0.1252 | 0.1247 | 0.1266 | 0.1243 | 0.1249 | 0.1248 | . . . | 0.1247 | 0.1266 |
| 7 | 4 | 0.1266 | 0.1238 | 0.1244 | 0.1252 | 0.1272 | 0.1238 | 0.1260 | 0.1252 | 0.1259 | . . . | 0.1229 | 0.1266 |
| 7 | 7 | 0.1278 | 0.1248 | 0.1269 | 0.1261 | 0.1246 | 0.1255 | 0.1238 | 0.1249 | 0.1250 | . . . | 0.1254 | 0.1257 |
| 7 | 10 | 0.1259 | 0.1237 | 0.1238 | 0.1239 | 0.1245 | 0.1243 | 0.1259 | 0.1246 | 0.1220 | . . . | 0.1252 | 0.1237 |
| 7 | 13 | 0.1233 | 0.1223 | 0.1247 | 0.1232 | 0.1245 | 0.1252 | 0.1241 | 0.1258 | 0.1250 | . . . | 0.1269 | 0.1247 |
To import ASCII xyz-1 data select 'import ASCII' → 'xyz-1 ASCII' from the 'File' menu bar. A standard file window will appear which allows browsing the directory structures of your computer or network connections. Select then the xyz-1 ASCII data file and press the 'load' button. In case of problems try first to import one of example files (xyz-1.txt or xyz-1d.txt) from the testdata directory (C:\Program files(x86)\CytoSpec\CytoSpecRoot\Testdata\ASCII\xyz\) before contacting CytoSpec support.
Import yxz-2 ASCII Data
This option permits loading ASCII data from hyperspectral imaging experiments.
The example below illustrates the expected format of a xyz-2 ASCII data file.
xyz-2 ASCII files contain four columns.
First column: spatial coordinate x
Second column: spatial coordinate y
Third column: wavenumber or frequency positions (from high to low values)
Fourth column: intensity / absorbance / transmittance values
The separator is tab
| 6.97 | -89.09 | 2000.61 | 12461 |
| 6.97 | -89.09 | 1999.65 | 12585.6 |
| 6.97 | -89.09 | 1998.69 | 12474.8 |
| 6.97 | -89.09 | 1997.72 | 12543.1 |
| 6.97 | -89.09 | 1996.76 | 12616.5 |
| 6.97 | -89.09 | 1995.8 | 12464.2 |
| 6.97 | -89.09 | 1994.83 | 12576.6 |
| 6.97 | -89.09 | 1993.87 | 12432.1 |
| 6.97 | -89.09 | 1992.9 | 12461.5 |
| ... | ... | ... | ... |
| ... | ... | ... | ... |
| 24.97 | -71.09 | 103.726 | 74.2909 |
| 24.97 | -71.09 | 102.481 | 54.2039 |
| 24.97 | -71.09 | 101.235 | 18.0652 |
| 24.97 | -71.09 | 99.9897 | 26.0901 |
To import xyz-2 ASCII data select 'import ASCII' → 'xyz-2 ASCII' from the 'File' menu bar. A standard file window will appear which allows browsing the directory structures of your computer or network connections. Select then the xyz-2 ASCII data file and press the 'load' button. In case of problems try first to import the example files (xyz-2.txt) from the testdata directory (C:\Program files(x86)\CytoSpec\CytoSpecRoot\Testdata\ASCII\xyz\) before contacting CytoSpec support.
Import yxz-3 ASCII Data
This option permits loading ASCII data from hyperspectral imaging experiments.
The example below illustrates the expected format of a xyz-3 ASCII data file.
xyz-3 ASCII files contain 'zdim+1' lines with zdim being the number of wavenumber points.
First line: The string Wavenumber followed by the [x,y] pixel coordinate indicator in the format xabc_ydef.
'abc' denotes the spatial x-coordinate and 'def' the spatial y-coordinate of the [x,y] pixel spectrum given in the row below
First column: wavenumber positions
All other columns: Raman intensities / IR absorbance values at the spatial coordinate [x,y] indicated at the first line
The separator is always tab
| Wavenumber | x328_y10 | x329_y10 | x330_y10 | x331_y10 | ... | ... | x354_y23 |
| 127.641131575598 | 0 | 8 | 22 | 0 | ... | ... | 3 |
| 129.860372149211 | 0 | 0 | 0 | 12 | ... | ... | 0 |
| 132.079061610446 | 105 | 114 | 120 | 154 | ... | ... | 48 |
| 134.297200153334 | 105 | 132 | 139 | 153 | ... | ... | 37 |
| 136.514787971806 | 125 | 127 | 107 | 123 | ... | ... | 47 |
| 138.731825259696 | 101 | 115 | 122 | 140 | ... | ... | 40 |
| 140.948312210763 | 126 | 125 | 152 | 152 | ... | ... | 41 |
| 143.16424901865 | 140 | 156 | 159 | 167 | ... | ... | 53 |
| ... | ... | ... | ... | ... | ... | ... | ... |
| ... | ... | ... | ... | ... | ... | ... | ... |
| 2667.61915321996 | 510 | 601 | 716 | 811 | ... | ... | 269 |
| 2669.24499882825 | 515 | 648 | 694 | 884 | ... | ... | 300 |
| 2670.87048852193 | 511 | 611 | 754 | 882 | ... | ... | 262 |
| 2672.49562240946 | 494 | 587 | 718 | 841 | ... | ... | 255 |
To import xyz-3 ASCII data select 'import ASCII' → 'xyz-3 ASCII' from the 'File' menu bar. A standard file window will appear which allows browsing the directory structures of your computer or network connections. Select then the xyz-3 ASCII data file and press the 'load' button.
Import Binary Data
CytoSpec offers importing hyperspectral data in various formats, among them a number of manufacturer-specific hyperspectral imaging formats.
Note, that CytoSpec is a hyperspectral imaging software - therefore, the import of point spectra is usually not supported.
Agilent®
(Digilab®)
Hyperspectral imaging data (*.dat) files acquired with the
 Resolutions Pro software from
Agilent®, former Varian®, former Digilab®, or BioRad®) can be loaded in the native format. Please note that the
*.dat and the *.bsp file (same file name!) must reside in the same directory.
Resolutions Pro software from
Agilent®, former Varian®, former Digilab®, or BioRad®) can be loaded in the native format. Please note that the
*.dat and the *.bsp file (same file name!) must reside in the same directory.
Agilent®
(Mosaic files)
CytoSpec's import filter for mosaic files acquired with Agilent's
Resolutions Pro software. Please note that the *.dmt file and the complete series of mosaic tiles (*.dmd
files) must reside in one directory. Please do not change files names. The root file name must not be modified!
AFMIR
AFMIR data files. Import filter for AFMIR data.
Alfasoft®
(Grams 3D)
Galactic Grams32, now Alfasoft, hyperspectral
Grams 3D multifiles (*.spc). No problems have been reported so far.
Bruker®
CytoSpec offers import of
Bruker OPUS multifiles. The filter allows importing OPUS hyperspectral data files, including mapping
and FPA data.
Aug. 2019 (CytoSpec v. 2.00.06, Release 360b): Update of the Bruker OPUS import filter which supports now also
importing 64-bit hyperspectral data files (so-called mosaic FPA data).
CytoSpec
The import filter for hyperspectral data in the
CytoSpec data format.
Horiba Jobin-Yvon®
The import filter for Horiba Jobin-Yvon ASCII (xyz) data files. This filter requires conversion into an ASCII data format
by the data acquisition software. Hyperspectral data can be also imported via Alfsasoft's® spc data format. This requires
conversion of Raman hyperspectral images into the spc data format.
Kaiser®
Kaiser Raman Holospec data files. Import filter for Kaiser Raman Holospec data files. Requires conversion into an ASCII
data format.
Matlab®
The import filter for hyperspectral images in a Matlab
compatible data format. Details of this file format can be found in CytoSpec's online documentation for the
Matlab file format.
NT-MDT®
NT-MDT data files. The CytoSpec import filter for NT-MDT multispectra (Matlab script files).
Photothermal®
The Photothermal ( Photothermal Spectroscopy Corp.)
filter allows importing *.ptir files that may contain PTIR and/or Raman hyperspectral data. Spectral data are imported via
the HDF5 format. The filter has been introduced with CytoSpec version 2.00.07 from Oct 2023.
PerkinElmer®
The filter allows loading hyperspectral data collected with PerkinElmer's
SpectrumSpotlight IR data
collection software. The filter allows import of *.fsm files. No problems reported so far. Note that *.sp files cannot be
imported by this filter.
Renishaw®
(WiRE 4.0)
Import filter for Renishaw WiRE
*.wdf spectral hyperspectral data files. This filter has been introduced with CytoSpec version 2.00.02 and supports importing of WiRE
4.0 *.wdf mapping data files in Renishaw's native hyperspectral data file format.
Renishaw®
(ASCII)
Import filter for Renishaw WiRE *.txt Raman
data files (ASCII data format). Renishaw 3D data files can be also imported by CytoSpec via Alfasoft's® spc data data format.
Requires conversion of Raman hyperspectral images into the spc data format.
When loading spc data you may have to enter the values for xdim and ydim (number of pixel spectra in x- and y-direction). This
information is sometimes not contained in the converted spc data files.
Thermo®
(Nicolet)
Thermo Atlus (former Nicolet®) *.map data files. Updated (CytoSpec v. 2.00.01) import filter for Atlus version 7 mapping
data files.
Thermo®
(Thermo/Raman)
Import routine for Thermo/Raman data files acquired by OMNICxi Raman imaging software for the
DXR3®xi Raman Imaging Microscope. CytoSpec allows importing of Raman maps stored in the HDF5 data format (*.h5, hdf5
libraries version 1.6.4). Note that the *.h5 import filter is supported only by CytoSpec's 64-bit toolbox (CytoSpec 64-bit
stand-alone, or Matlab pcode toolbox).
August 2023, Cytospec 2.00.07 (build 372): The Thermo/Raman import *.h5 filter has been updated.
WITec®
pre-v.2.10
Import filter for WITec confocal Raman microspectrometer data
produced by the WITec Project software 2.0x. Requires conversion into an ASCII data format. Assumes the presence of two separate
ASCII text files in the same directory
WITec®
v.2.10
Import filter for WITec confocal Raman microspectrometer data
produced by the WITec Project software 2.10. Requires conversion into an ASCII, or spc data format. See
this description for details).
WITec®
Project Four
Import filter for WITec confocal Raman microspectrometer data
produced by the WITec Project Four software. Requires conversion into a Matlab format. Project Four data files can be also imported
via the ASCII, or spec format. In these cases refer to the description of the WITec®v.2.10 import filters (see above).
Note that some import filters are still in an experimental stage and may be based on incomplete information
of the internal file structures.
Bug free operation of these filters cannot be guaranteed! Import
filters have been tested using data of the directory 'C:\program files(x64)\CytoSpec\CytoSpec\Testdata' (Windows installation,
default installation path).
Testdata are also available form the CytoSpec website, see
here (download binary and ASCII test data) for details.
In case case of problems try first to import / load the test data and only then contact the CytoSpec support (support@cytospec.com).
| Agilent® (Digilab®) |
Hyperspectral imaging data (*.dat) files acquired with the
|
| Agilent® (Mosaic files) |
CytoSpec's import filter for mosaic files acquired with Agilent's
|
| AFMIR | AFMIR data files. Import filter for AFMIR data. |
| Alfasoft® (Grams 3D) |
Galactic Grams32, now Alfasoft, hyperspectral
|
| Bruker® | CytoSpec offers import of
Aug. 2019 (CytoSpec v. 2.00.06, Release 360b): Update of the Bruker OPUS import filter which supports now also importing 64-bit hyperspectral data files (so-called mosaic FPA data). |
| CytoSpec | The import filter for hyperspectral data in the
|
| Horiba Jobin-Yvon® | The import filter for Horiba Jobin-Yvon ASCII (xyz) data files. This filter requires conversion into an ASCII data format by the data acquisition software. Hyperspectral data can be also imported via Alfsasoft's® spc data format. This requires conversion of Raman hyperspectral images into the spc data format. |
| Kaiser® | Kaiser Raman Holospec data files. Import filter for Kaiser Raman Holospec data files. Requires conversion into an ASCII data format. |
| Matlab® | The import filter for hyperspectral images in a |
| NT-MDT® | NT-MDT data files. The CytoSpec import filter for NT-MDT multispectra (Matlab script files). |
| Photothermal® | The Photothermal ( |
| PerkinElmer® | The filter allows loading hyperspectral data collected with PerkinElmer's
|
| Renishaw® (WiRE 4.0) |
Import filter for |
| Renishaw® (ASCII) |
Import filter for |
| Thermo® (Nicolet) |
Thermo Atlus (former Nicolet®) *.map data files. Updated (CytoSpec v. 2.00.01) import filter for Atlus version 7 mapping data files. |
| Thermo® (Thermo/Raman) |
Import routine for Thermo/Raman data files acquired by OMNICxi Raman imaging software for the
August 2023, Cytospec 2.00.07 (build 372): The Thermo/Raman import *.h5 filter has been updated. |
| WITec® pre-v.2.10 |
Import filter for |
| WITec® v.2.10 |
Import filter for |
| WITec® Project Four |
Import filter for |
Export Spectral Data
This function permits exporting spectral data to other applications. Spectral data can be exported for re-classification (complete hyperspectral
images) or as a selection of spectra for teaching classification models. The routine includes a number of options for data reduction such as
the selection of spectral windows and an average function operating in the spectral domain. The export function offers furthermore specialized
routines for automated feature selection such as ANOVA, Kruskal-Wallis and
COVAR. Data can be exported in a format that is specific for the following
applications:
- SNNS/JavaNNS: the Stuttgart
Neural Network Simulator
- GA_ORS: Genetic Algorithm - Optimal Region Selection, a command line based UNIX/LINUX tool for analysis of IR, Raman and MRI
data (optimization, feature selection).
- TOOLDIAG:
TOOLDIAG is a command line based UNIX/LINUX tool for multivariate data analysis (classification,
feature extraction, feature selection, etc.)
- csv format: spectra are stored as comma separated values in one ASCII file. The first column contains the spectral vector of
wavelength, wavenumber, or Raman shift values.
- x,y-ASCII text files: simple export function for spectra export to applications software such as OPUS (
Bruker Optics), Grams/AI (
Alfasoft®),
Microsoft Excel, or Origin (
OriginLab).
- JCAMP-dx: export of spectral data files into the JCAMP-dx data format.
- Galactic spc: spectra are exported as single files via the spc data format.
- Matlab mat: pixel spectra, their [x,y] pixel coordinates and other information is converted and copied for export in a Matlab structure
array. The structure array can be stored in a Matlab data format.
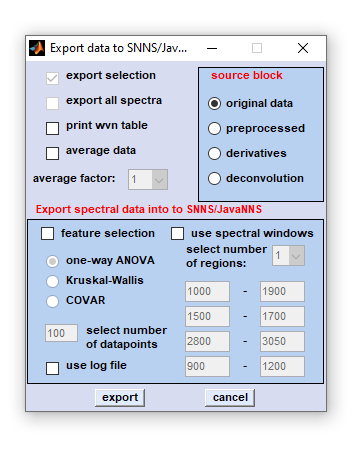
Options of the CytoSpec data export/feature selection routine
|
export selection: Check this checkbox to export a selection of spectra. If unchecked complete hyperspectral images are exported. Details of how to select spectra for export are given below). |
|
number of spectral windows: please indicate the number of spectral windows. use log file: a log file from a previous CytoSpec export session can be loaded. This function is required for creating external validation hyperspectral image image tests sets. When this option is chosen the settings for feature selection and spectral window selection of a previous CytoSpec export session are loaded and utilized. IMPORTANT: after loading the log file, the checkbox 'export all spectra' which is usually inactivated becomes activated. In this way it is possible to export complete hyperspectral images for external validation (classification) purposes to applications like the SNNS, or ga_ors. export: press this button to open a standard Windows, or LINUX file browser. Choose an appropriate file name and the target directory. cancel: aborts the export function |
|
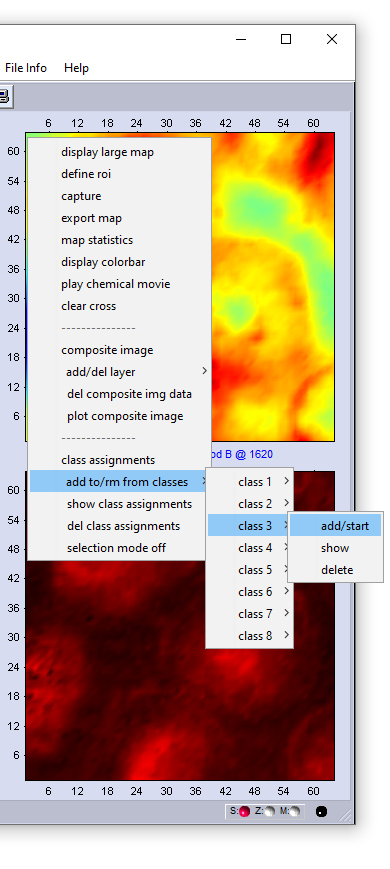
Manual selection of [x,y] pixel spectra for data export
Either a complete hyperspectral image, or a selection of point spectra can be exported. The following section describes the procedure of selecting and assigning [x,y] point spectra to classes, or spectra categories.
|
1. The context menu shown in the screenshot to the left can be obtained by a mouse click (right button). 2. To assign point spectra to class 1 choose 'class 1' → and 'add/start'. This activates the 'select spectra' mode. In this mode, the mouse cursor changes the appearance (arrow plus cross). 3. Select now an unlimited number of spectra by left mouse clicks. Please note that spectra are not displayed in this mode. The spatial coordinates will be indicated in the report (command line) window, see below. 4. To assign spectra to another class select 'class X' → and 'add/start'. Add then point spectra as it is described above. 5. If all spectra are selected, stop the selection mode by choosing 'selection mode off' from the context menu. CytoSpec returns to the standard mode 'show spectra' and the mouse pointer will regain its normal appearance. You can now call the 'export' function and export selected spectra. Delete selections / delete class assignments: Deleting class assignments can be carried out either for a class of choice by selecting 'class X' → and 'delete' (see screenshot to the left); or for all classes by selecting 'delete class assignments' from the context menu. Show class assignments: To display class assignments for an individual class of spectra select the 'class X' → and 'show' function. Alternatively, one can also use the 'show class assignments' function from the context menu. The screen output of the 'show class assignments' function is exemplary illustrated in a screenshot of the CytoSpec report window (see below). |
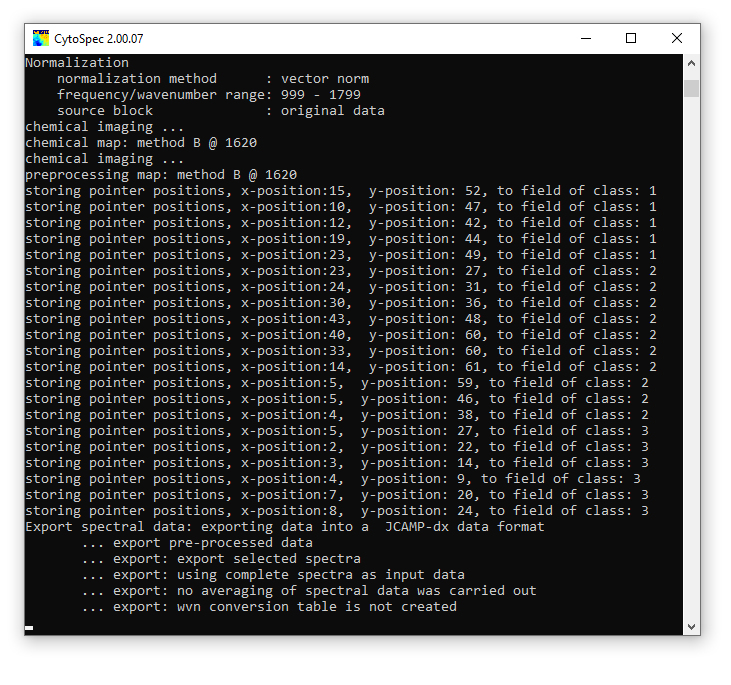
were consecutively executed)
Delete Data Blocks
This function is helpful to organize the spectral data, e.g. to reduce memory or disk requirements. Choose one of the following data blocks
that can be deleted:
- preprocessed data.
- derivative data.
- (de)convolution data.
A detailled description of CytoSpec's internal data organization can be found
here.
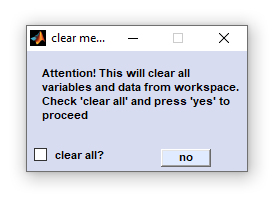
Clear Workspace
This function clears the existing workspace by removing all existing hyperspectral image data. All existing data are lost if not stored
before. The 'clear'-function may be useful to free memory before performing memory-consuming calculations such as hierarchical
clustering (HCA).
Plot Data
This function allows plotting CytoSpec's main window as an eps (encapsulated postscript) file. Eps graphic files can be import by vector
graphic software like CorelDraw.
Use the capture function for storing pseudo-color images in a bitmap
(bmp) image format: To store the zdata information - the data used to generate the pseudo-color images - in an ASCII data format use
the export maps function of the 'Tools' menu bar. Furthermore,
screenshots of CytoSpec's main window can be obtained by the capture
function of the 'Tools' menu bar.
Options
Options: This function is useful for defining program settings such as
- the memory management mode, or
- the way of how NaN values are handled when constructing pseudo-color images
- define the format of stored spectra files
- define whether spectra files to be stored are supplemented by standard deviation spectra
- a permanent program work directory
Memory management modes: CytoSpec offers two distinct memory management modes. This functionality was introduced to allow highly
memory consuming operations also with limited RAM resources. With version 2.00.01 and the availability of the
64-bit version of CytoSpec the memory mode 'compress' is obsolete and has been removed.
- 'speed' the fastest mode, but highly memory consuming. Recommended for hierarchical cluster analysis (HCA) with hyperspectral
images containing up to 128 x 128 pixel spectra (32-bit version, 4 GB of RAM required). In this mode all spectral data are hold in memory
with 8 byte precision as float64 values. The option is recommended also for HCA of larger hyperspectral data sets when using
64-bit versions of CytoSpec
- 'intermediate' - relatively fast, but less memory consuming. Try this option when data sets are large and/or the amount of
installed RAM is low. Spectral data are stored with 4 byte precision as float32 values on disk. Only the required data block will be
stored in memory (RAM). When performing HCA, the distance matrix is stored in RAM.
- 'compression' - this memory option has been removed with version 2.00.01 (see
64-bit version of CytoSpec for details).
Plot NaN's: NaN spectra, also called 'bad pixel spectra', are produced by the quality test and some other routines: If
the quality test of a given spectrum is negative, the respective spectrum in the data block of preprocessed data will be replaced
by NaN (Not a Number) values.
The checkbox 'plot NaN's' defines the way how NaN pixel spectra are handled when constructing pseudo-color images containing NaN
spectra. If this checkbox is not active (unchecked) NaN spectra will be plotted as black squares. Note that in such cases the size of
the square may be larger than the original pixel area, which is due to fact that pseudo-color images are usually created by certain
interpolation. If the checkbox is checked, NaN pixel values will be replaced by some numeric values beyond the lower data limit.
These pixel values are then mapped to the color used to represent the minimum values of false color images (e.g. blue in case of the
standard colormap 'jet').
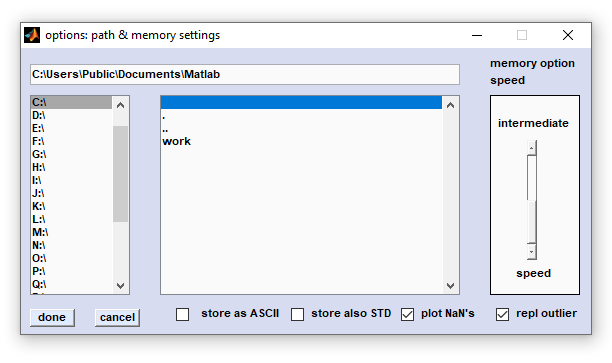
Screenshot of the figure 'options: path & memory settings'
Store as ASCII: This checkbox defines the format used to store average spectra produced by multivariate imaging functions like
hierarchical clustering (HCA), k-means clustering (KMC) and others, endmember spectra obtained by vertex component analysis (VCA) or
n-findr, or the format of mean spectra defined by the region of interest (ROI) tool.
If the checkbox 'store as ASCII' is checked, spectra will be stored as double column ASCII files (first column: frequency or
wavenumber values, second column: intensity/absorbance/transmittance data, separator: space). Otherwise, spectra are stored in a binary
data format (*.spc).
Store also STD: Allows to store also standard deviation spectra when using the 'save mean spectra' routines of
multivariate imaging functions like HCA or KMC imaging, or the ROI tool (see above). Check this checkbox to save mean and std
spectra when storing cluster mean spectra, or mean spectra from ROIs.
The format used to store std spectra is controlled by the checkbox 'store as ASCII'
Batch Multiple Spectra Files
Batch multiple files. CytoSpec versions 1.2.02 and later permit automatated batch preprocessing of hyperspectral image data. The
'batch multiple files' function is based on the batch preprocessing
routine and requires a predefined fully operational macro file (*.cbt -CytoSpec batch).
Before starting the 'batch multiple files' routine it is strongly recommended to carefully check the 'batch preprocessing'
function for possible errors.
How to use the function 'batch multiple files'?
First, it is required to create a text file which contains path and file name of the batch preprocessing file (first line) followed by paths
and file names of the spectral multifiles to be processed (next lines). An example of such a batch file is given
here (version for Windows OS). All batch files should have the extension '*.fnm'.
The 'batch multiple files' function can be used to import and preprocess hyperspectral image data of various origins. Supported file
formats are Matlab (*.mat), Agilent (former Varian, Digilab, or Biorad) Resolutions Pro (*.dat), Bruker OPUS (*.0), Thermo OMNIC (former
Nicolet) (*.map), Thermo/Raman (*.h5), Grams/32 (*.spc), PerkinElmer (*.fsm), Renishaw (WiRE 4.0 *.wdf), WITec Project Four/Five Matlab (*.mat)
and CytoSpec (*.cyt).
Spectral data are processed as defined by the batch file order and are stored after processing in the directory where the original data
file reside. For storing processed HSI data files either CytoSpec's data format, or a Matlab data format will be used. The HSI file name
will constructed from the original file name with the extensions '_1.cyt' (CytoSpec) , '_1.mat' (Matlab, original data block
only), or '_2.mat' (Matlab, all data blocks) added.
An example batch file for CytoSpec under the LINUX operating system is part of the respective pcode toolbox (btchmltflslnx.fnm).
It is not possible to batch-process multivariate imaging functions such as agglomerative hierarchical clustering.
Video tutorial spectral and spatial preprocessing with CytoSpec (Youtube):
(in this video, utilization of the function 'batch multiple files' is exemplified after position 10:02 min)
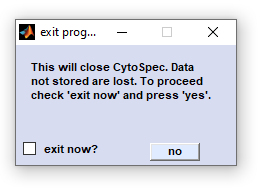
Exit
Exit: Closes all windows and performs a shutdown of the program. Data not stored are lost.
[
GENERAL |
FILE |
SPECTRAL PREPROCESSING |
SPATIAL PREPROCESSING |
UNIVARIATE IMAGING |
MULTIVARIATE IMAGING |
TOOLS |
FILE INFO |
GLOSSARY |
CONTACT: info@cytospec.com |
PUBLISHER DETAILS |
PRIVACY POLICY ]
Copyright (c) 2000-2024 CytoSpec. All rights reserved.
FILE INFO |
Copyright (c) 2000-2024 CytoSpec. All rights reserved.